In this article, we delve into the intricate relationship between Federal Reserve policies, inflationary trends, and their implications for the real estate market. As we navigate through the complexities of economic forecasts and housing projections, we aim to provide clarity and actionable insights for our readers. From dissecting the latest data on inflation to analyzing Fannie Mae’s housing forecasts, we uncover the realities facing potential homebuyers and existing homeowners alike. Join us as we explore the truth about waiting to buy real estate and why delaying could prove costly in today’s economic landscape.
Understanding the Economic Landscape:
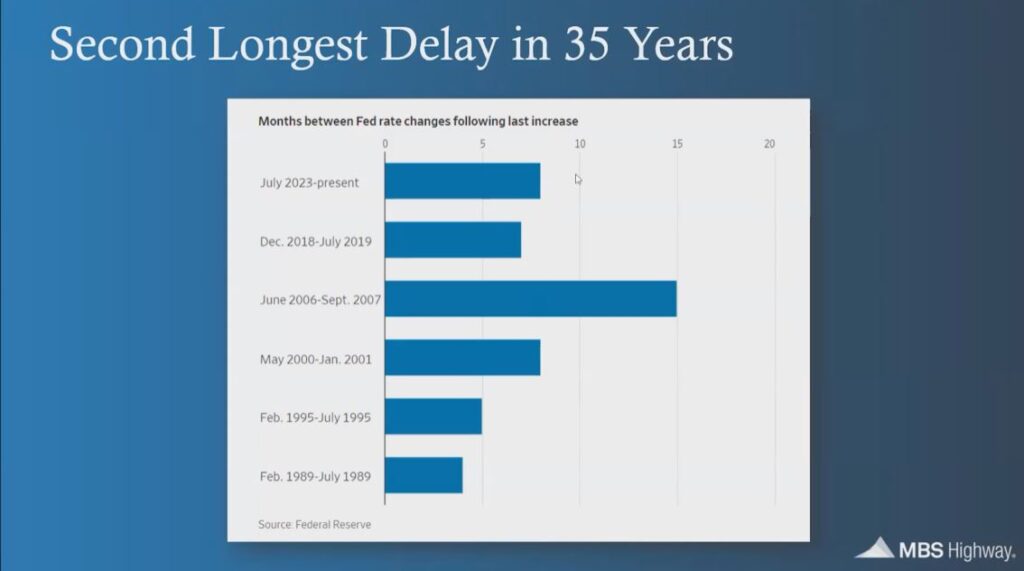
In an economic landscape where the delay between the last Fed hike and the first rate cut stands as the second longest period since 1989, the implications for prospective homebuyers and existing homeowners are significant. This delay, only surpassed by the period preceding the 2007-2008 financial crisis, prompts crucial considerations for those navigating the real estate market. With uncertainty looming over future rate cuts, understanding the dynamics driving these decisions becomes paramount.
Months Between Fed Rate Changes Following Last Increase:
Analyzing Inflationary Trends:
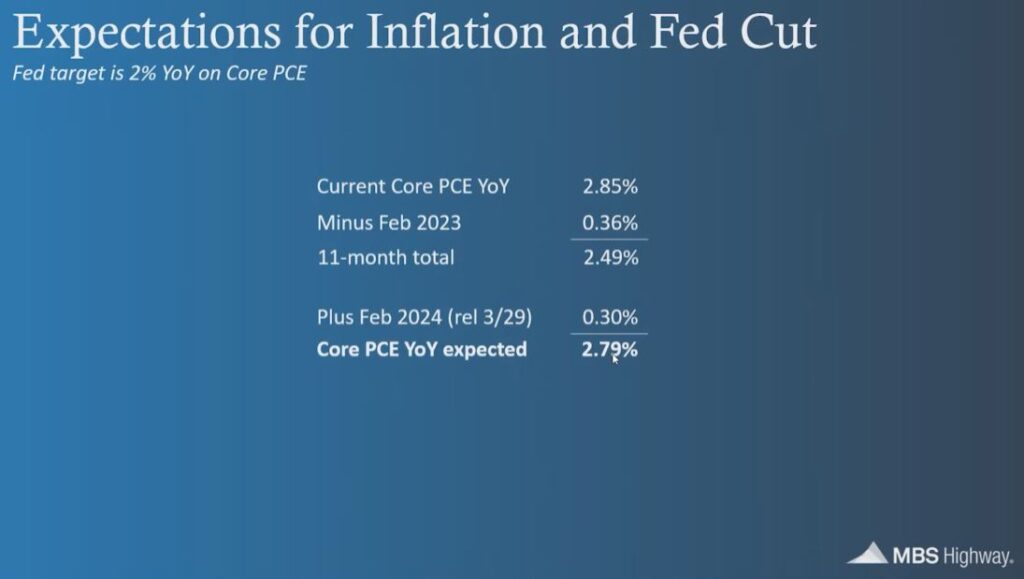
Typically, in a restrictive rate environment, what usually drives the Feds to start cutting rates is the reduction of inflation and ultimately getting the percentage back to their comfort zone, or close to 2%. Let’s review the expectations for inflation and Fed cuts over the next several months. The first chart shows progress in overall inflation coming down. After next week’s inflation report, we should see the Feds’ best measure of inflation (the Personal Consumption Expenditure, or PCE) coming down. However, 2.79% is still above their comfort zone of 2%. In the second chart, using estimates of what the PCE could be and those that it replaces, even at the end of 2024 the inflation percentage could still be greater than their target rate of 2%.
Personal Consumption Expenditure Chart, February ’24:
Personal Consumption Expenditure Chart, Through End of ’24:
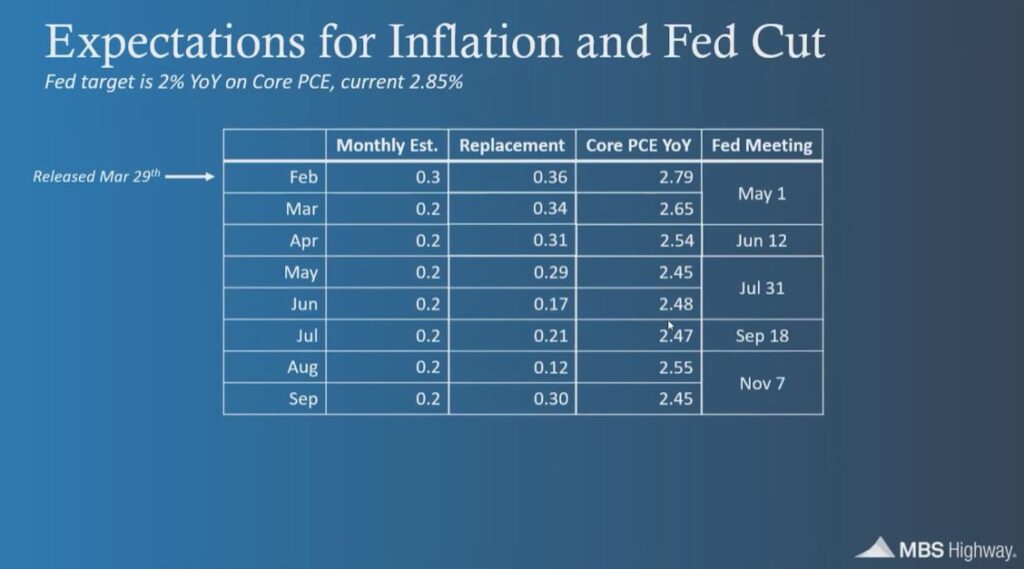
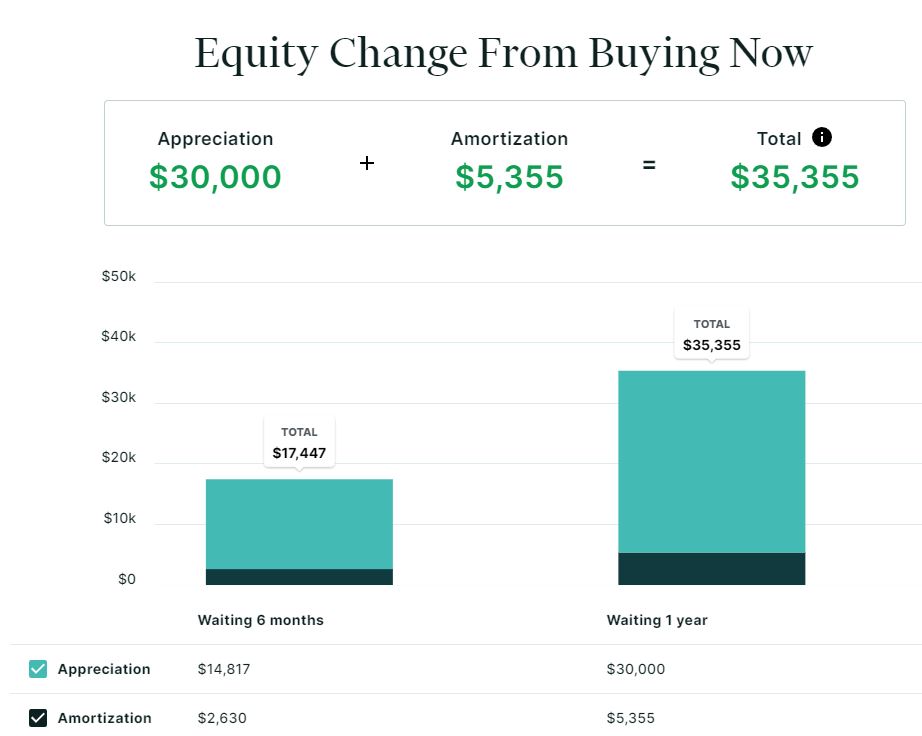
So, what does this mean? Potential homebuyers looking to purchase their first home or existing homeowners waiting to buy when rates fall could be losing thousands of dollars in amortization and appreciation considering the forward-looking data does NOT support rate cuts.
Examining the Fannie Mae Housing Forecast:
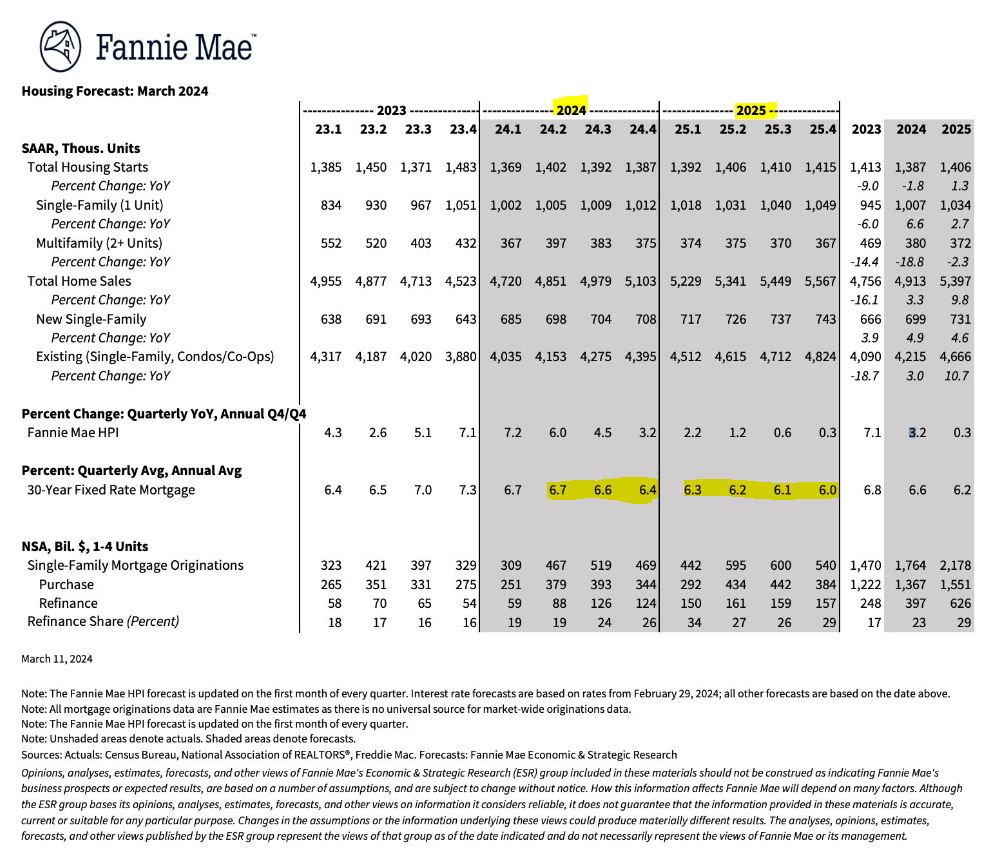
Let’s briefly review the “latest” Fannie Mae housing forecast for March 2024. The chart below shows mortgage rates to hold steady and range from the mid to high 6’s. As we head into 2025 they will reduce slightly to the low 6 percent range. This current estimate (revised from the end of 2023) shows an increase in mortgage rates. For example, the previous forecast for Quarter 2 of 2024 was 6.3%. Now the estimate is almost .5% higher and is true for all future Quarters of 2024.
Fannie Mae Housing Forecast: March 2024:
The Cost of Waiting: Financial Implications for Homebuyers:
In summary, first-time homebuyers and potential move-up homeowners will see the biggest impact on their real estate wealth by purchasing sooner in 2024. Both estimated inflation percentages and the revised mortgage rate chart don’t help to improve the housing market and could cost a homebuyer hundreds to thousands of dollars in a relatively short period. A simple example below shows how much a buyer would give up in amortization and appreciation over a 6 month or one-year period.
Cost of Waiting: The True Numbers:
Here’s a short video showing the substantial loss in real estate wealth by choosing to wait and buy later this year.


